Augmenting Duffl's Restock Process
Creating the Supply UI

Read about my journey designing and developing custom full-stack software to alleviate the growing pains of a $30M delivery startup.
What is Duffl?
Duffl is a convenience store delivery service startup for college students boasting a delivery to doorstep time of 10 minutes. The company participated in Y Combinator’s W2020 batch and raised $12M in Series A funding back in 2021. Currently, Duffl operates at 7 locations across 3 states. But long before the establishment of large warehouses and streamlined systems came humble beginnings.
The Early Days
Upon the arrival of shipments, each product underwent manual assignment of inventory count and location. Locations included shelves, fridges, and freezers of varying sizes which posed space constraints issues. We determined future shipments based on the number sold in the previous week and naively updated inventory after restocking and sales. As far as the restocking process, a restocker would consult a central inventory page, where inputting a product name would yield a product photo, inventory amount, and locations to which it belonged.
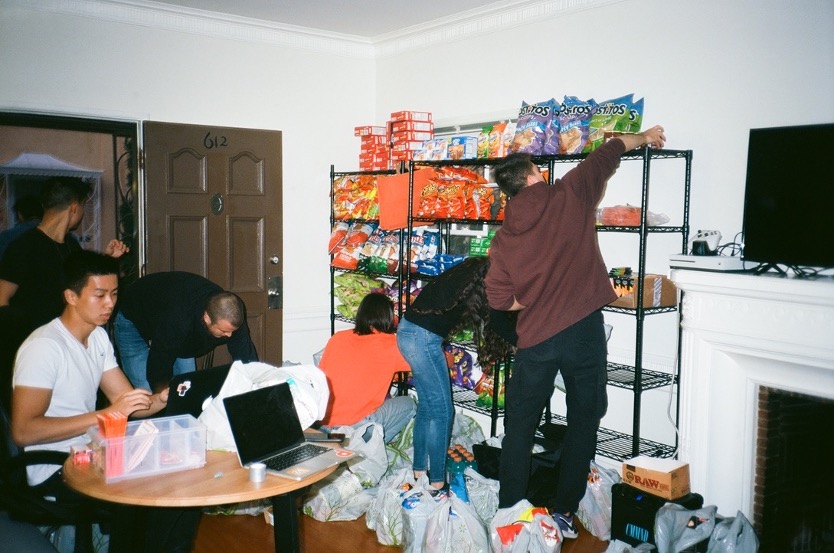
The earliest stages involved Costco runs and only a few storage rooms with shelves.
Problem
- Frequent overstock and understock across products
- Lack of accurate inventory insight led to popular items running out of stock
- No visibility into product cost patterns
- Excessive time dedicated to maintaining product organization
- The assembly time for couriers to put together an order increased as the store became more crowded
- Lack of a means to discern the time of purchase results in the wastage of perishable goods
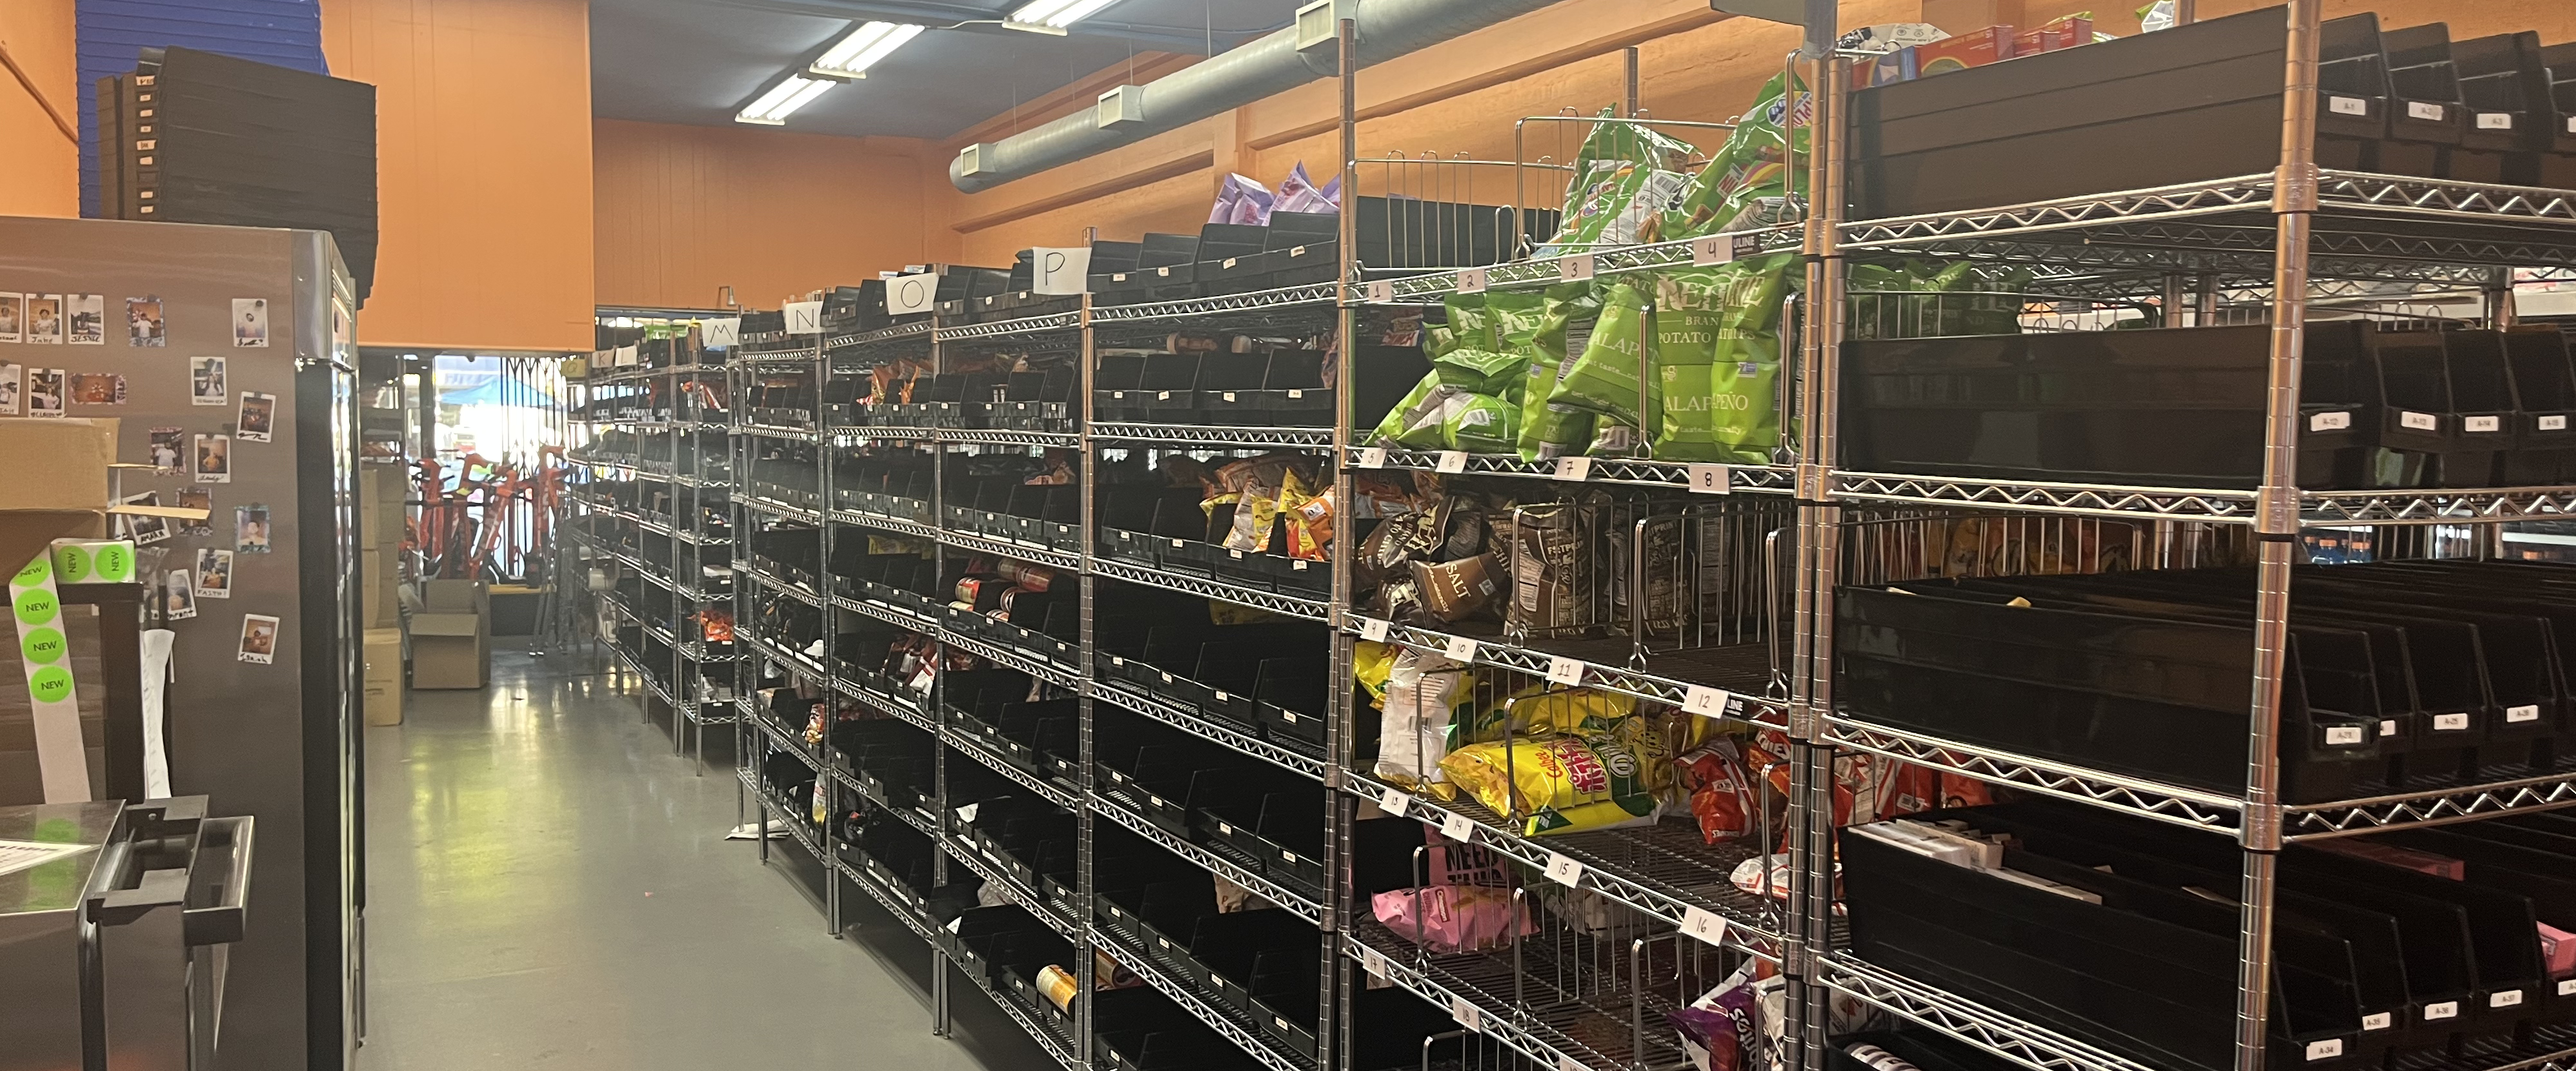
The inside of our second location, where more space meant more problems...
Design Process
As an engineering team, we agreed that a scalable solution lies in technology. To ensure a robust product that addresses the correct issues, I employed various research techniques to ensure user-centric design.
User Survey
Surveys were conducted among 35 warehouse managers and restockers, out of which 27 responded. The objective was to identify pain points in the restocking and buying process. Participants were incentivized by being awarded a $10 order discount on completion. The survey was administered through Google Forms and data was organized and analyzed on Miro. Warehouse managers handled the buying process and restockers handled restocking, however, since most employees have experience on both sides the questions were not specific to a particular role. Questions were designed based on the challenges listed above and meant to collect both quantitative and qualitative data.
Quantitative Questions
- On a scale of 1 to 5, how satisfied with you with the current restocking process?
- On a scale of 1 to 5, how satisfied with you with the current order-buying process?
- How often do you encounter errors or inaccuracies in shipment quantity while restocking? (Multiple times a day, Daily, Weekly, Monthly, Rarely)
Qualitative Questions
- What are the biggest challenges you face while restocking?
- What are the biggest challenges you face while buying an order?
- What is the biggest issue you see that leads to problems in the store?
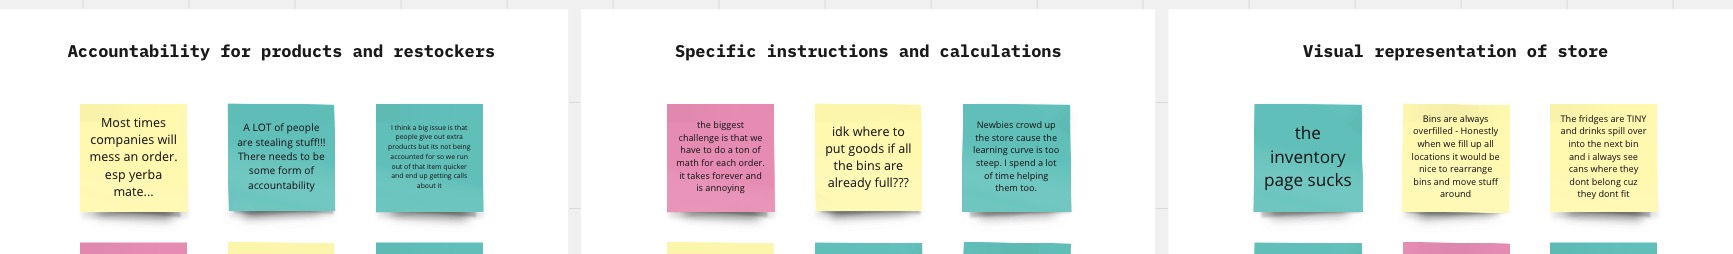
Qualitative responses were grouped by the needs they represented and color-coded by the question they came from
Key findings
- There is a need to keep track of every product from the moment it is purchased from the supplier to the moment it is restocked
- There is a need to provide employees with specific instructions and calculations to minimize error rates
- There is a need to offer a better visual representation of the store
Wireframes
I created a wireframe on Figma that addressed each of these newly discovered needs.
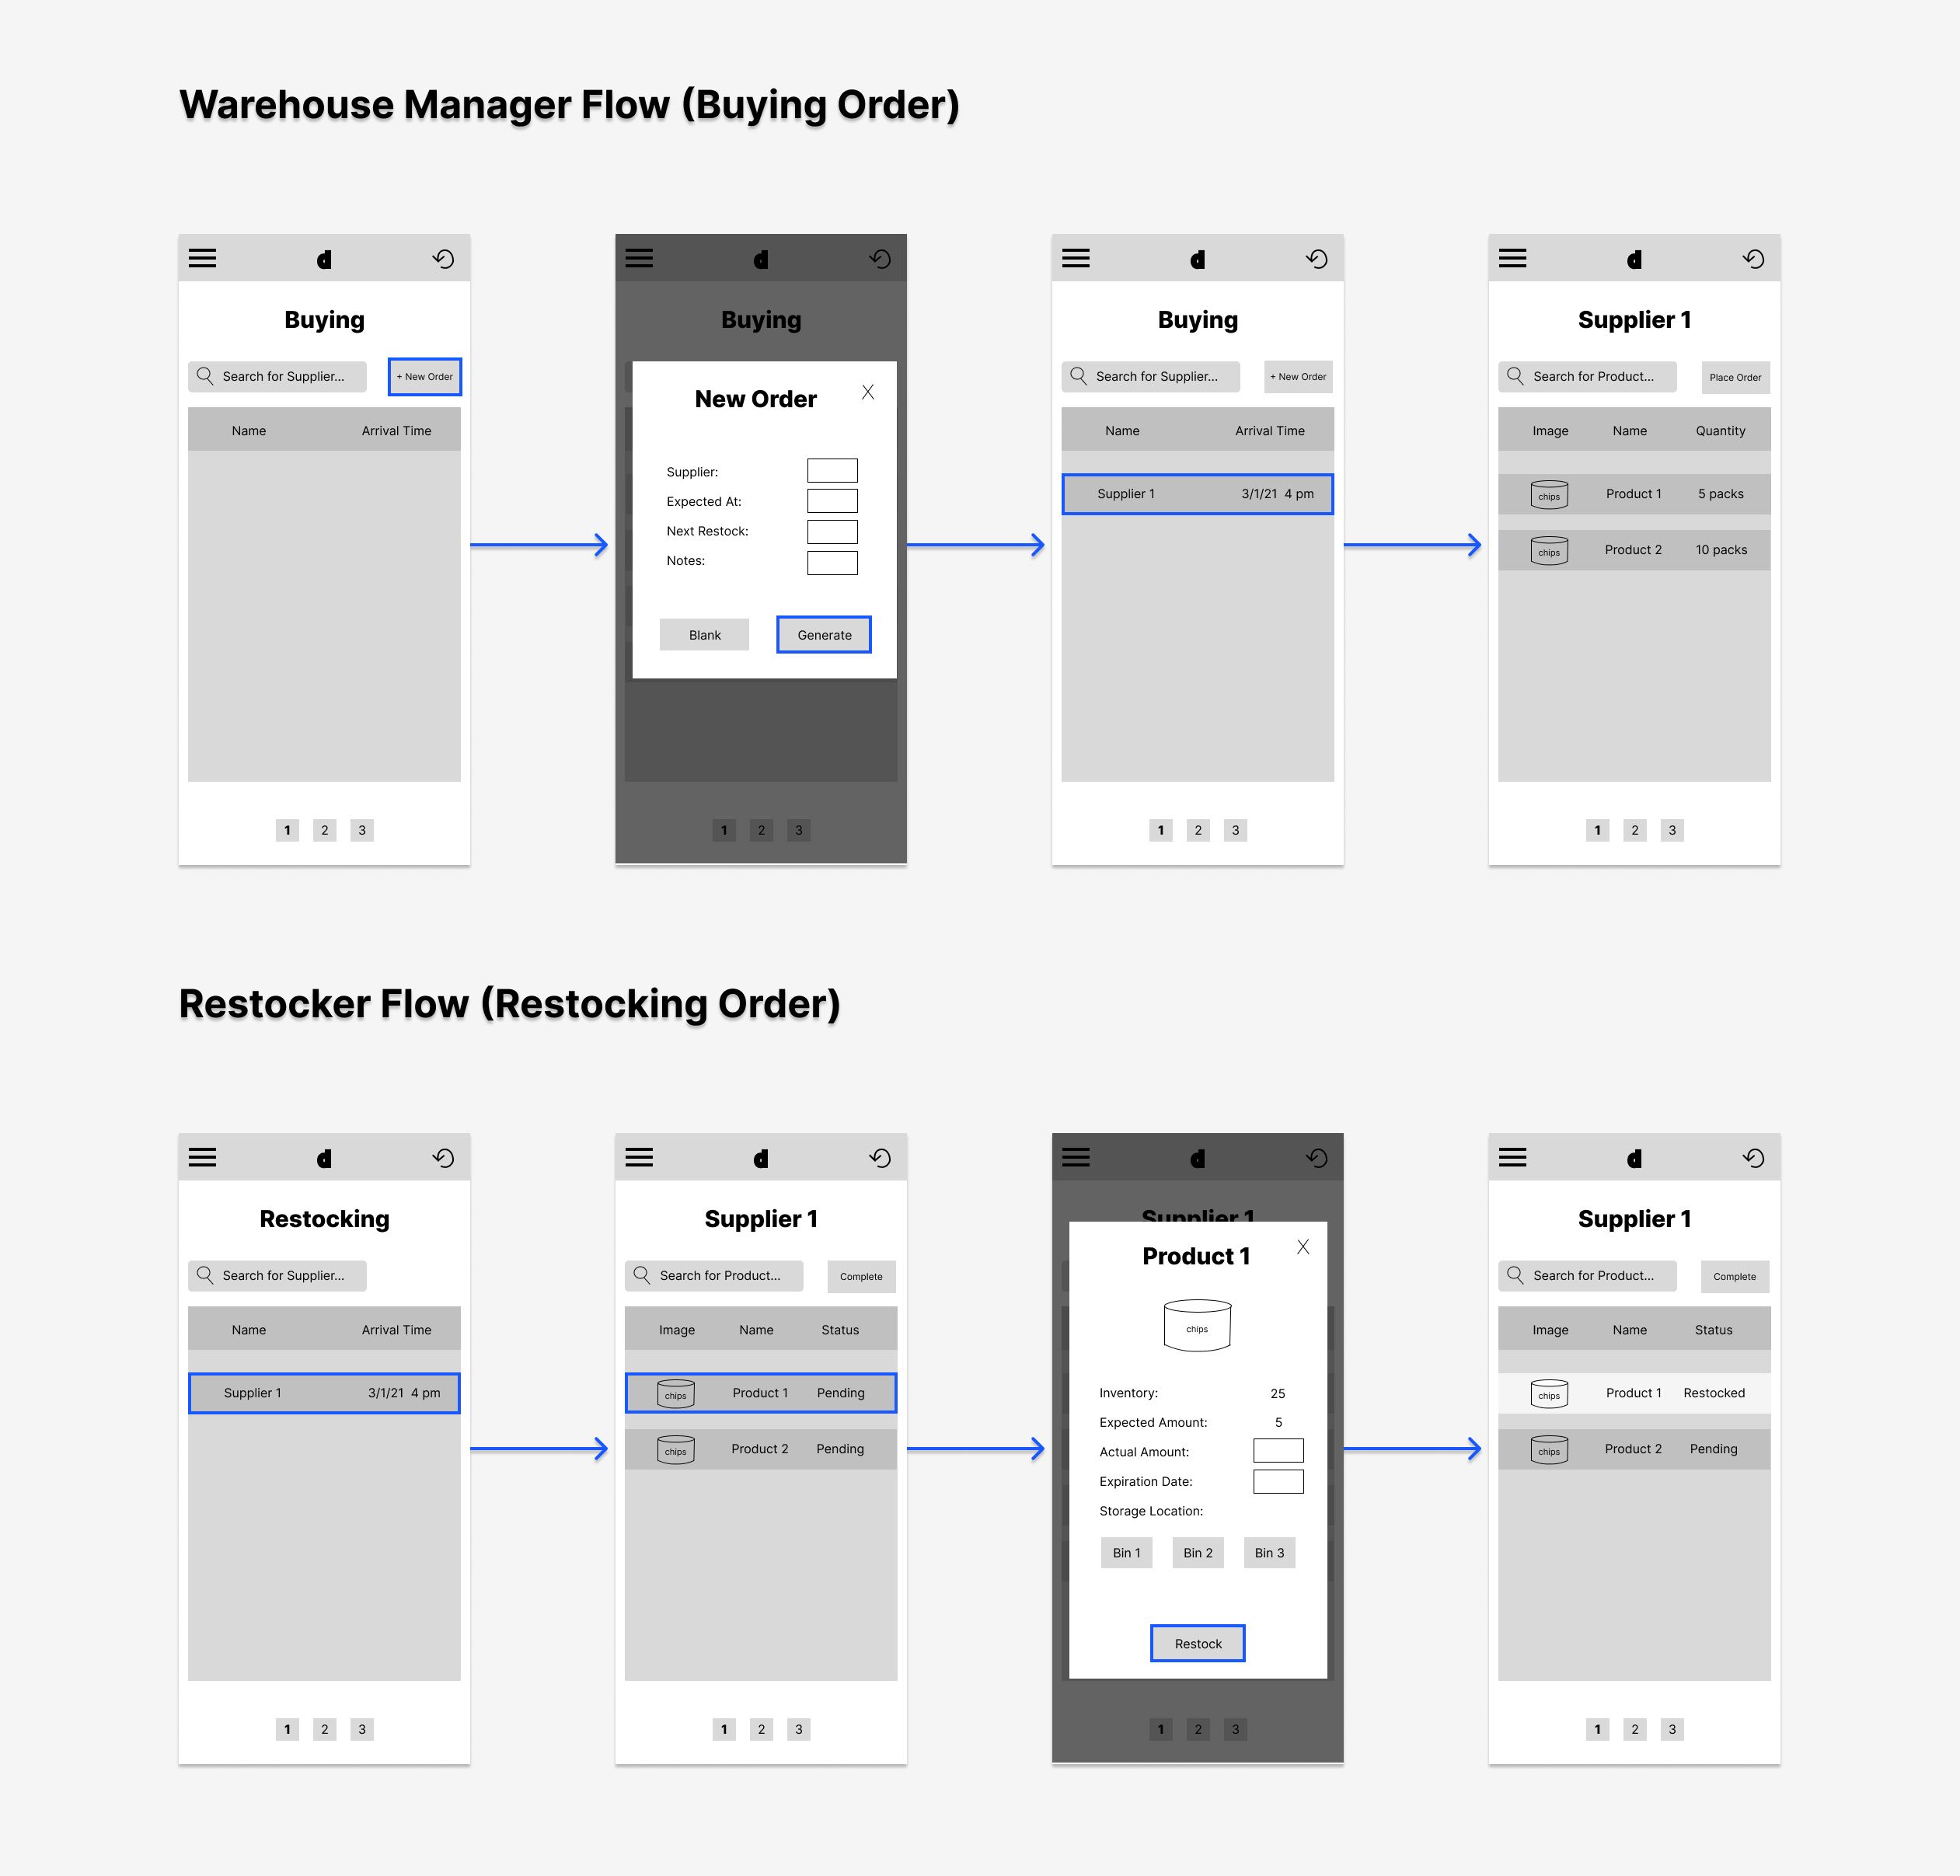
Wireframes for the buying and restocking flows that I presented to the team.
Usability Testing
To evaluate the usability and effectiveness of the design, I conducted a moderated user testing session where participants consisting of warehouse managers and restockers were instructed to “click” through the flow by physically interacting with the printed prototype.
Solution
Following successful usability testing, we were ready to build a UI that presents warehouse managers with visibility and management options for each product. Within this implementation, we would also reduce points of friction from the existing buying/restocking process and empower users to make informed decisions by offering algorithmically based recommendations along the way.
- Inventory UI: A user interface and system that works together to track and manage inventory details of various product abstractions in our store.
- Supply UI: A user interface to assist with the buying and restocking process and the corresponding backend functionalities to support recommendations and interactions with the inventory system. I led the charge on this project and will be spending the rest of this post detailing my implementation. The wireframe above reflects this UI.
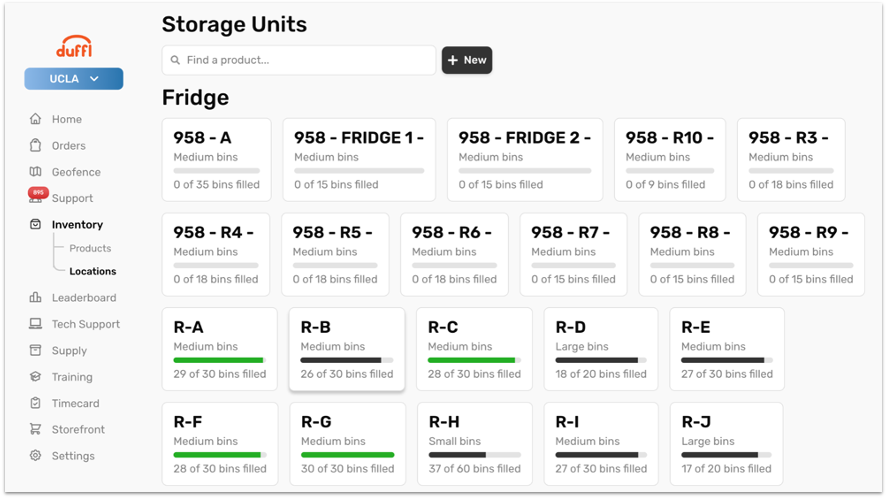
The completed view of Inventory UI for product tracking and management, designed and implemented by Elliot Fouts.
Frontend
Overview
- table view with each row representing a “restock order” and relevant column labels between tabs.
- filter/unfilter by date function that defaults to the current day. This feature is particularly useful for reviewing past restocked orders for potential issues and planning for upcoming orders to place.
- debounced search input that sends query params to the backend and receives a filtered set of orders to display.
- custom pagination component that sends the page number stored in URL param to the backend and receives a filtered set of orders to display.
Buying Tab
The Buying tab supports an option to generate a new order based on the supplier, expected delivery date, and new restock date. A backend algorithm, detailed later in this post, puts together a recommended order for the warehouse manager to place with the supplier. The warehouse manager can make changes they see fit or opt to start a blank order from scratch. This feature reduces user error by taking the legwork out of thinking and creates an order representation for us to track in our system.
The process of generating an order which a warehouse manager can later edit and place.
Restock Order Tab
Clicking into a restock order on any of the tabs will take you to a table view of the order itself complete with all the items and details. Because this view is primarily used for facilitating the active restocking process, I built it with a responsive design in mind. The flow is as follows:
- The “Expected Arrival” time displayed on the UI aligns with the unloading of multiple boxes from a supplier truck
- Restockers on shift cut open boxes and input items they will be restocking into the search bar on the restock order tab of the UI
- The UI tells them exactly where in the store the item belongs based on the bin label deduced by the backend
- The UI tells the restocker the number of items/packs to expect and allows the restocker to make changes if the actual quantity differs from the expected
- If product details need to be updated dynamically, they may access the product detail page directly from the restock modal and edit as necessary
- To account for expiring goods and reduce waste, the UI collects expiration dates for products tagged as perishable
- Product rows grey out with opacity when completed and once all items have been restocked, an order may be marked as completed at which point the order moves to the Completed tab
Challenges
React rerendering causing flickers
In the original hierarchy, some tables were placed lower down in the component tree than the input field. As a result, the table element would rerender leading to a flickering experience every time a user typed into the search bar. The solution was to anchor all modals to the topmost level of the application and control toggling through React context.
React.memo() to reduce rerender
A few months after release, a ticketing system was introduced that would make a polling API call in the background of the admin application every few seconds. This call would trigger a rerender of the restock table and cause a flicker. By wrapping the table render function with a React.memo(), I successfully prevented rerendering when no props were changed. While certainly not everything should be memoized, this was a suitable use case that resulted in a bug fix.
Backend
Our backend is built on top of the Django framework and interfaces with a MySQL database. We aimed to implement an intelligent system to guide warehouse managers in determining the optimal quantity of products for each order. Achieving this would reduce waste, cut down on out-of-stock items, lower rates of human error, and overall contribute to a more efficient and streamlined ordering process.
Rate of Sale
The first step requires calculating an item’s rate of sale (ROS). This is determined by # of units sold per hour it is available for purchase. To figure out the amount of time an item is live over 24 hours, I looked at “In Stock”/“Out of Stock” and “Store Open”/“Store Close” markers as depicted below.
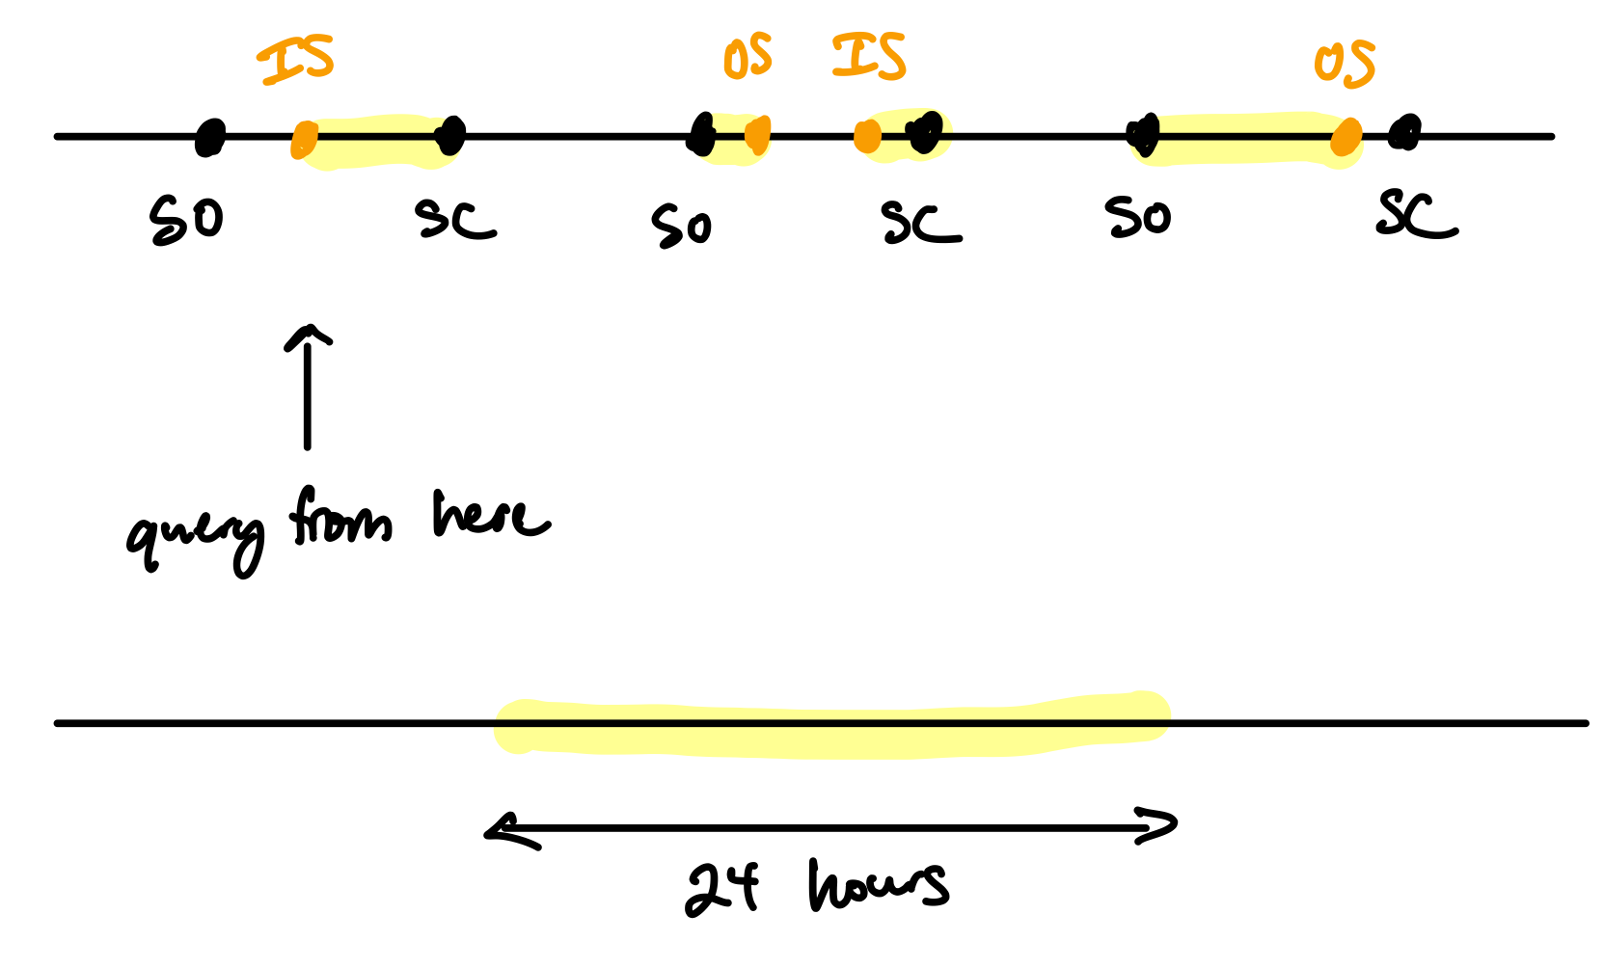
The highlighted areas on the top line represent the time frame in which an item is considered available for purchase.
Recommended purchase amount
Combining ROS with time between restocks gives us the total number of units needed in our store. Factoring in current inventory and the amount already purchased gives us the number of units we would need to purchase within an order.
# units to purchase = # units needed - # already purchased - current inventory
Divide by pack size and round up and we get the number of packs to order.
Generating a restock order
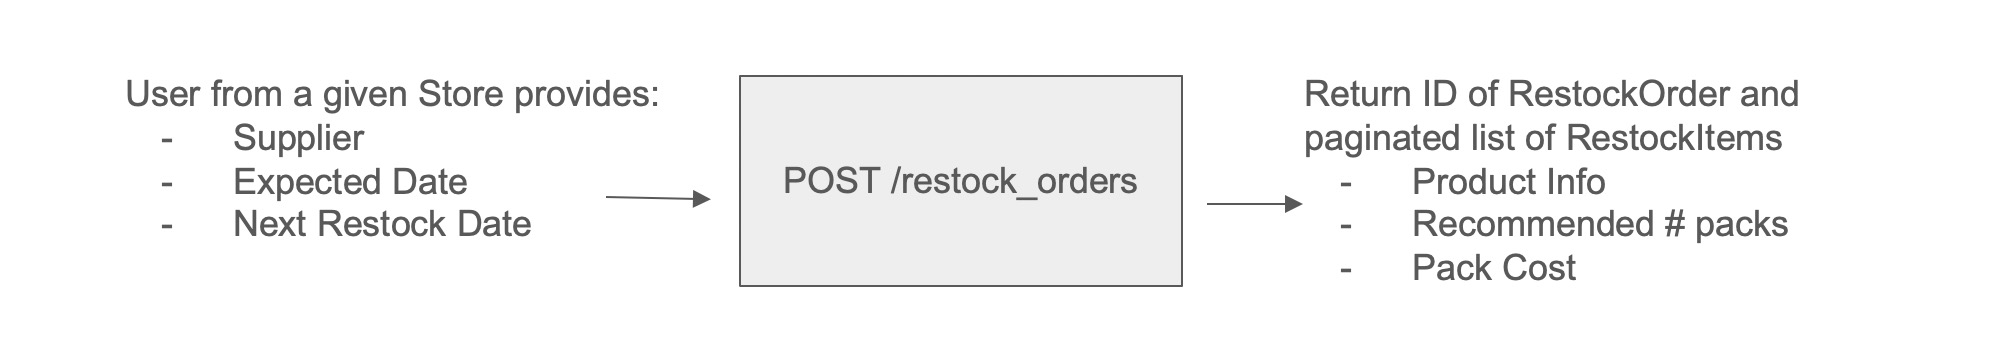
When a user generates a new order from the Buying tab, a post request is sent to the backend with the supplier name, expected date, and next restock date. In the backend RestockView, we fetch all active products from the store of the given supplier. We get pack size and price from a previous RestockItem. Then, we create a new RestockItem instance for each item in the order then assign them to the new RestockOrder. Finally, we return the ID of the RestockOrder and a paginated list of RestockItems with product info, recommended # packs, and pack cost for the UI to display.
Challenges
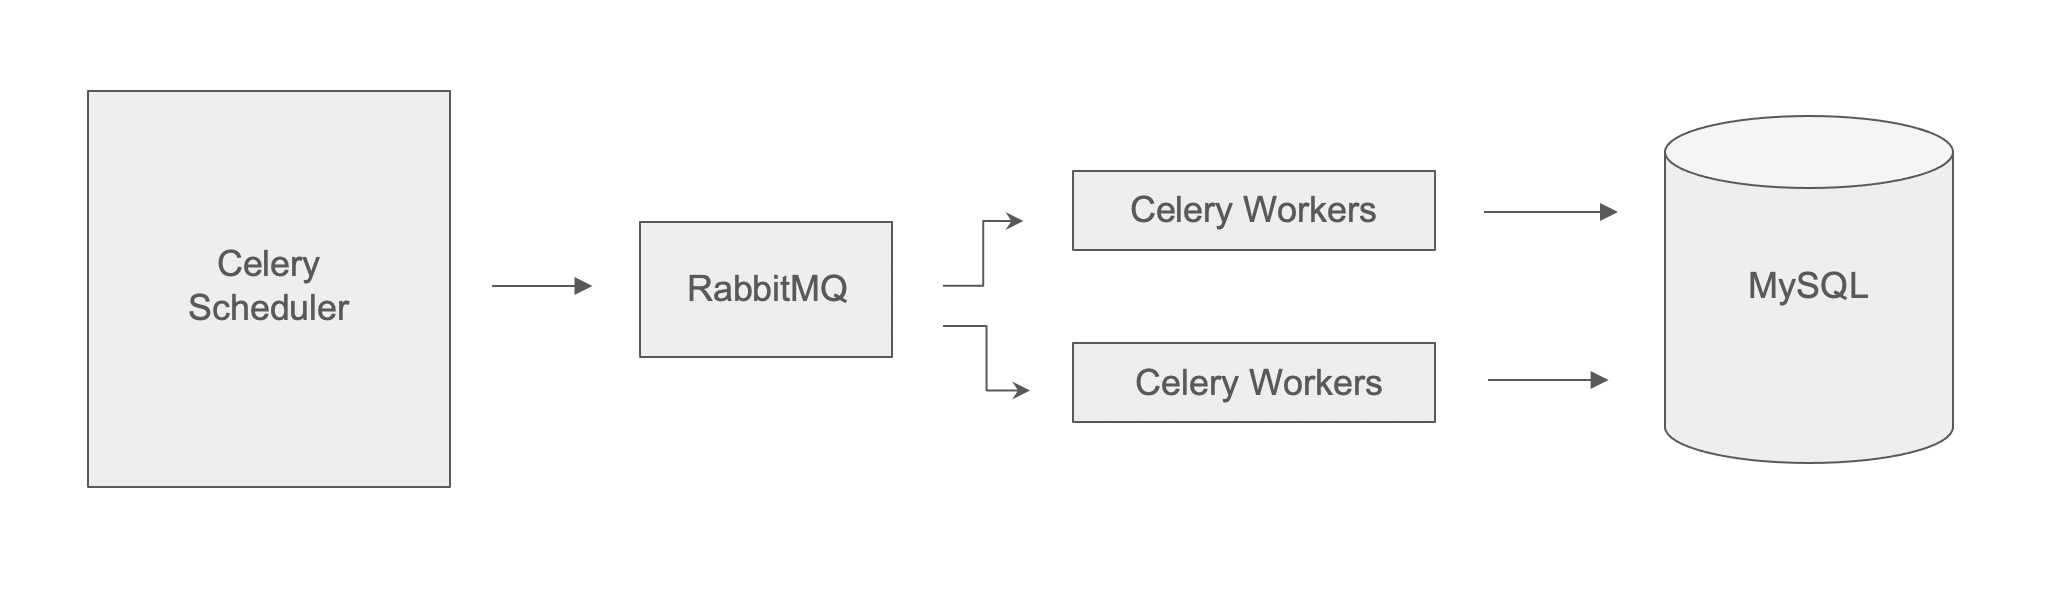
Calculating the rate of sale for all items proved to be a time-intensive process. Originally we performed these calculations as an asynchronous task in Django Q. However, Django Q was coupled to our web server and would end up competing for CPU and memory with other application functions. To optimize for performance, I offloaded the ROS calculation task to RabbitMQ + Celery and a cron job.
Reflection
As a result of better tracking and inventory management, we achieved a lower overall out-of-stock rate across all products. The improved organization allowed us to maintain low pick and pack times even as order volume increased. The ability to input and view expiration dates as a part of the restocking process reduced waste from expiring perishables. We significantly reduced the number of steps necessary to replenish products while at the same time significantly cutting down on user error. All said and done, we were able to achieve volumes of 700+ orders per day.
To successfully program software requiring as much user input as this one, I needed to spend time developing away from the computer. Many hours spent in the warehouse crowdsourcing feedback and getting my hands dirty led to numerous improvements in this feature over time and certainly added to a sense of reward upon completion. This combined with the opportunity to embed technology into one of the most labor-intensive aspects of our operation sets this project apart as one of the most meaningful products I have delivered so far in my software engineering journey. To this day Supply UI remains a source of insight into how a well-designed system and the use of technology can lead to a tangible improvement of real-world processes.
Further Readings

Credit Card and Payment Management | 8 min
An overview of my journey implementing multiple payment processing methods for Duffl.

Designing a Custom Logger Tool | 5 min
Considerations and functionalities of the custom internal logging tool for HealthSafe ID. Featuring some nuances of TypeScript enums and JavaScript symbols.